Compare the performance of both your own and your competitors web pages. Easily visualize the gaps between several web pages using the various performance indicators, page weight and the number of requests.
Use the comparison feature to:
- create a comparison report between two web pages (same or different websites)
- compare existing standalone reports (e.g. before and after optimization)
- replay simultaneously the videos related to the tested pages and compare their filmstrips.
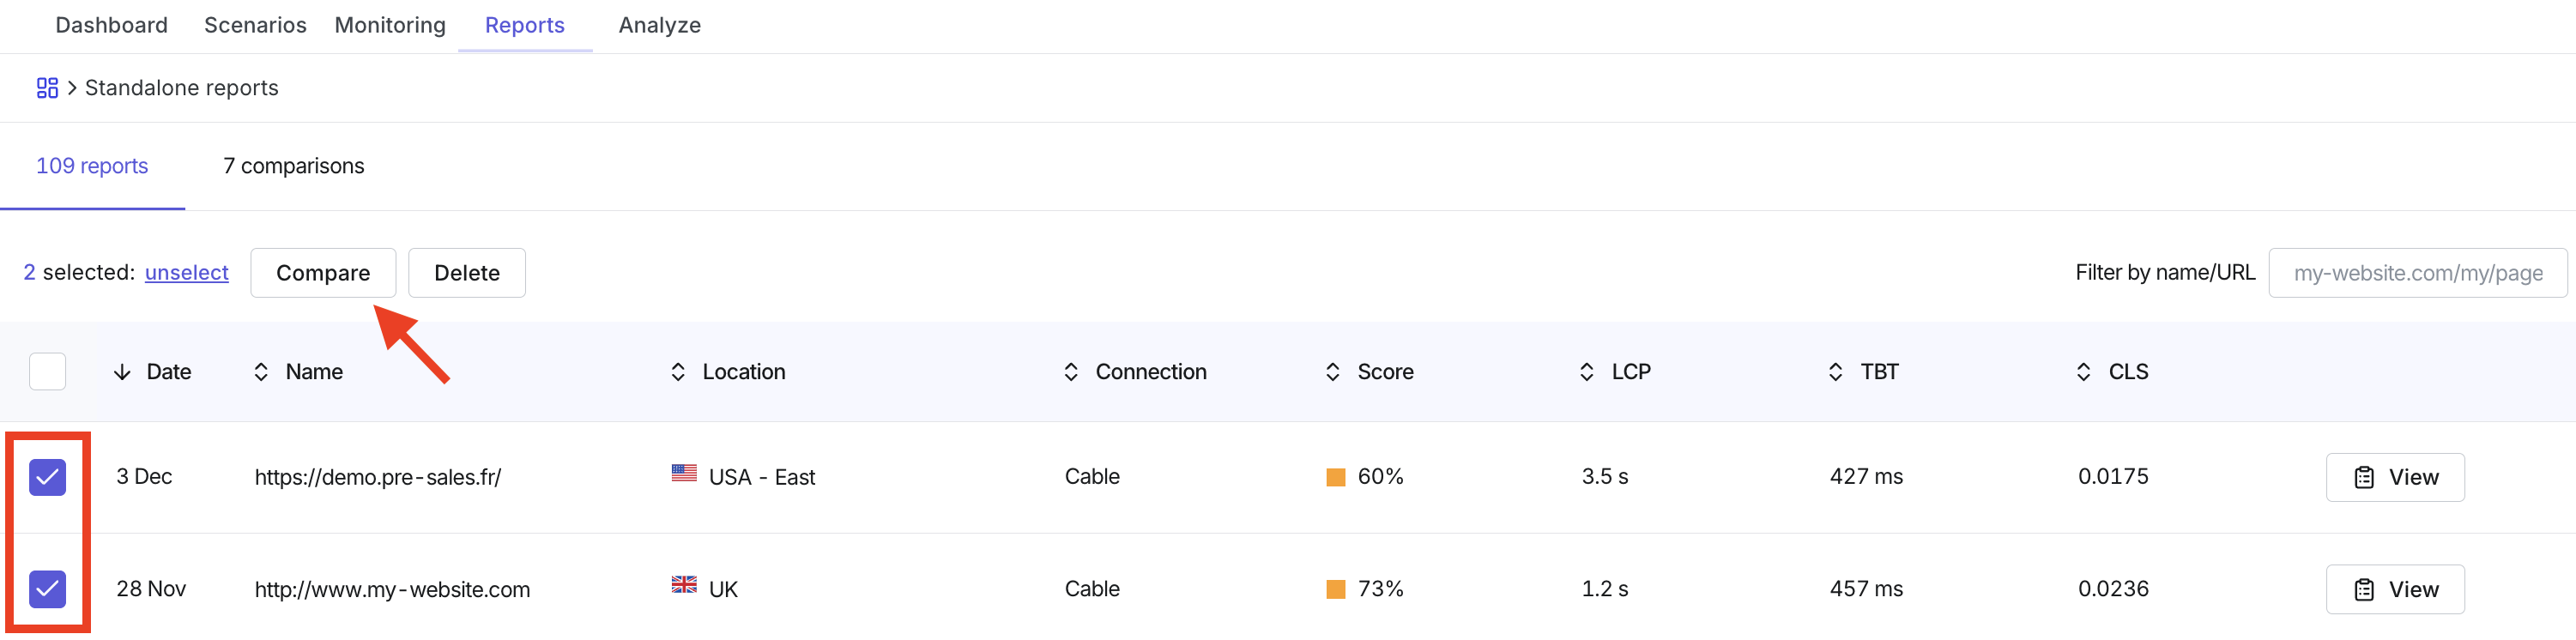
Compare existing reports from the Reports tab
Note: Comparing more than two pages
If you choose to compare more than two web pages, the retest and download report option will not be available. (You can still share the online version of the reports).
Follow these steps once you have already run multiple tests from the Analyze tab, which can then be found in the Reports tab.
- From the 'Web Performance' > 'Synthetic Monitoring' menu, go to the 'Reports' tab to see the full list of reports that have been run.
- Check the boxes of the reports you'd like to compare (compare up to 8).
- Select 'Compare'.
Create a new comparison from the Analyze tab
- From the 'Web Performance' > 'Synthetic Monitoring' menu, go to the 'Analyze' tab.
- Go to the 'Compare' tab.
- Select the type of comparison analysis you'd like to create (see below for more details on the comparison types).
- Complete the form details to define your comparison.
- Select 'Compare'.
Your comparison reports can be accessed from the Reports tab, under the '[x] comparisons' menu.
Comparison types
- Competitive comparison: Compare two different URLs to generate a comparison report between the two pages based, according to the very same test settings (these can be two URLs from your own website, or across different websites). Choose between mobile or desktop tests and select the location from which the two tests should be executed.
- Cache testing (1st vs 2nd visit): This report compares the web performance of a single page with a first and second visit to measure the efficiency of the browser cache. (The second display should be faster)
- Advanced comparison: Compare the same page or two different pages based on the complexity of contexts required.
Using the Comparison Report
Once you have launched your comparison analysis, the report will be stored in the reports tab and will also be available in your Synthetic Monitoring dashboard, in the section 'Comparison reports'.
Performance metrics
- See a comparison of the performance metrics between the two URLs being compared.
- Use the performance metrics dropdown to select the metrics you want to see.
- Click 'Report' to be directed to the full Synthetic Monitoring Report of that particular page.
- Click 'Waterfall' to be directed to the full Waterfall report of that particular page.
Weight by resources type
Use the 'Weight by resources type' bar chart to compare the weight of images between two pages.
Requests by resources type
Use the 'Requests by resources type' bar chart to compare the requests of images between two pages.
Visual progress of page rendering over time
Use the 'Visual progress of page rendering over time' to compare how long it takes for the visible page elements to finish rendering.
Video playback comparison
Use the video comparison to play back the loading of the web pages side-by-side to understand how the user experiences it.